Energy Tracking
Understand where your energy really goes.
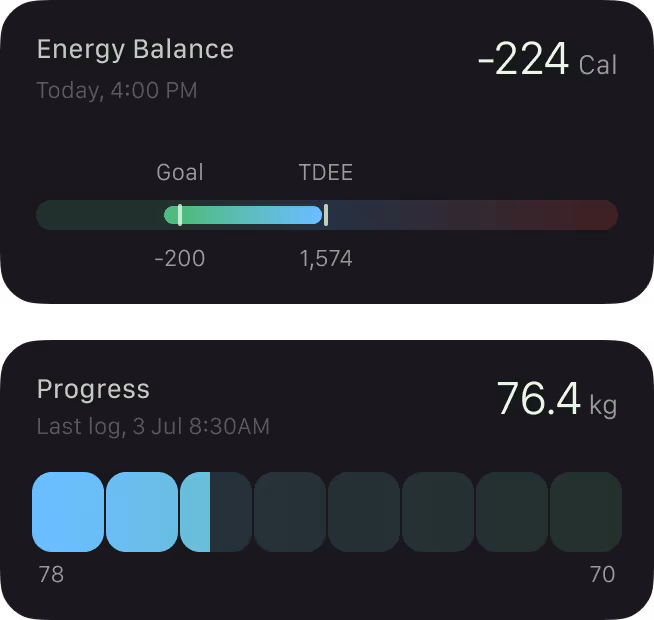
The food you eat is your body’s primary source of energy, but not all energy is created equal.
Bright helps you see how the energy you gain from food shows up across your day, connecting what you consume to how you feel, move, recover, and perform. By understanding the quality, timing, and balance of your intake, you can identify what fuels sustained energy, and what leads to crashes, fatigue, or poor recovery.
Instead of tracking food in isolation, Bright places energy from nutrition into the context of your overall health, helping you make smarter choices that support your activity, sleep, stress, and long-term performance.
Close
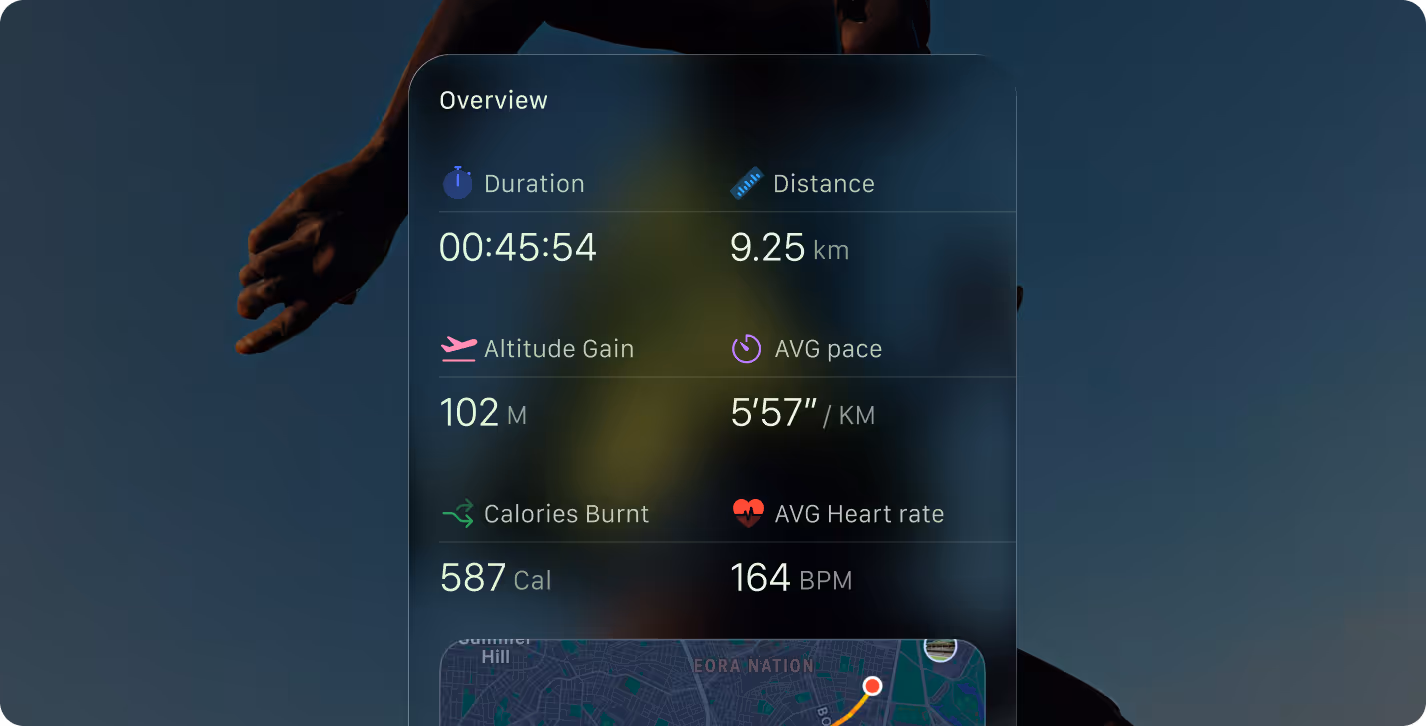
Activity Tracking
See how movement fits into your life.
Movement isn’t just workouts, it’s how active you are across your entire day.
Bright tracks your activity in context, showing how different types and intensities of movement influence your energy, recovery, and overall health. By connecting daily movement with sleep, nutrition, and stress, you can understand when activity supports your wellbeing, and when it starts to take more than it gives.
Instead of chasing steps or streaks, Bright helps you see how movement fits into your life, so you can stay active in ways that are sustainable, balanced, and aligned with how your body feels.
Close

Sleep monitoring
Sleep,
decoded.
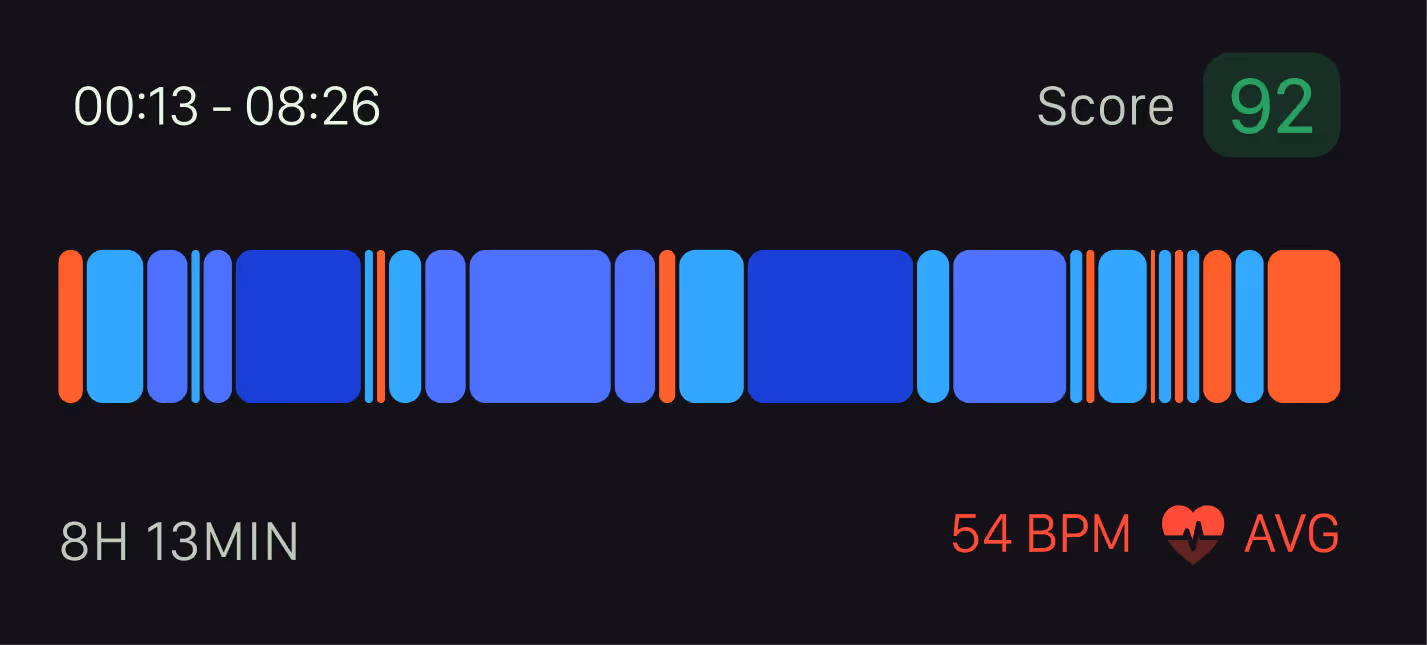
Sleep is where your body resets, but its impact reaches far beyond the night.
Bright breaks down your sleep into clear, meaningful signals and connects them to how you feel, move, and perform during the day. By understanding patterns in duration, quality, and consistency, you can see how sleep supports your energy, recovery, and resilience to stress.
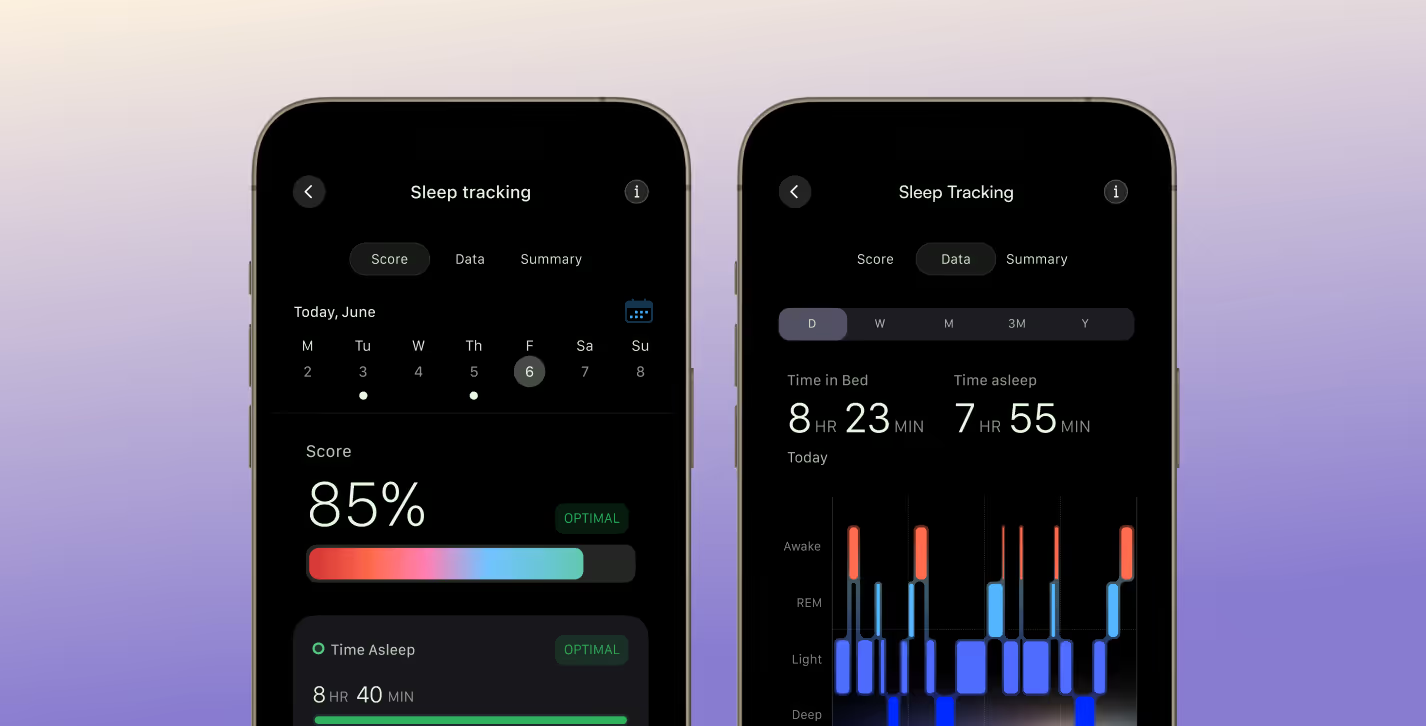
Rather than treating sleep as a standalone metric, Bright places it at the centre of your overall health—helping you recognise what improves your sleep, what disrupts it, and how better rest translates into better days.
Close
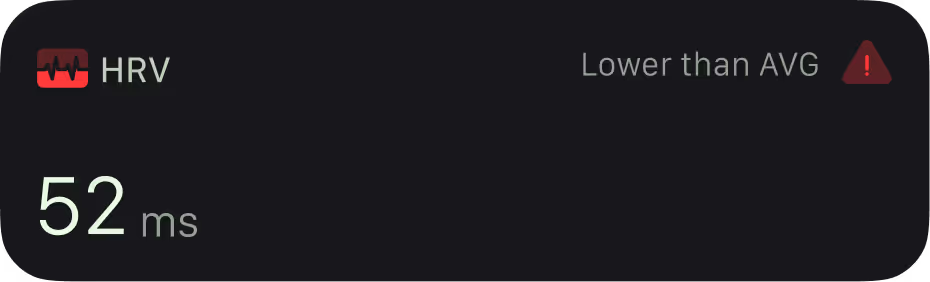
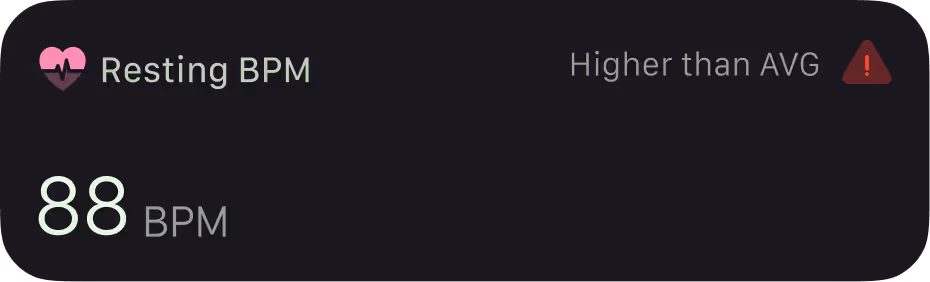
Heart Fitness
A clearer picture of your cardiovascular health.
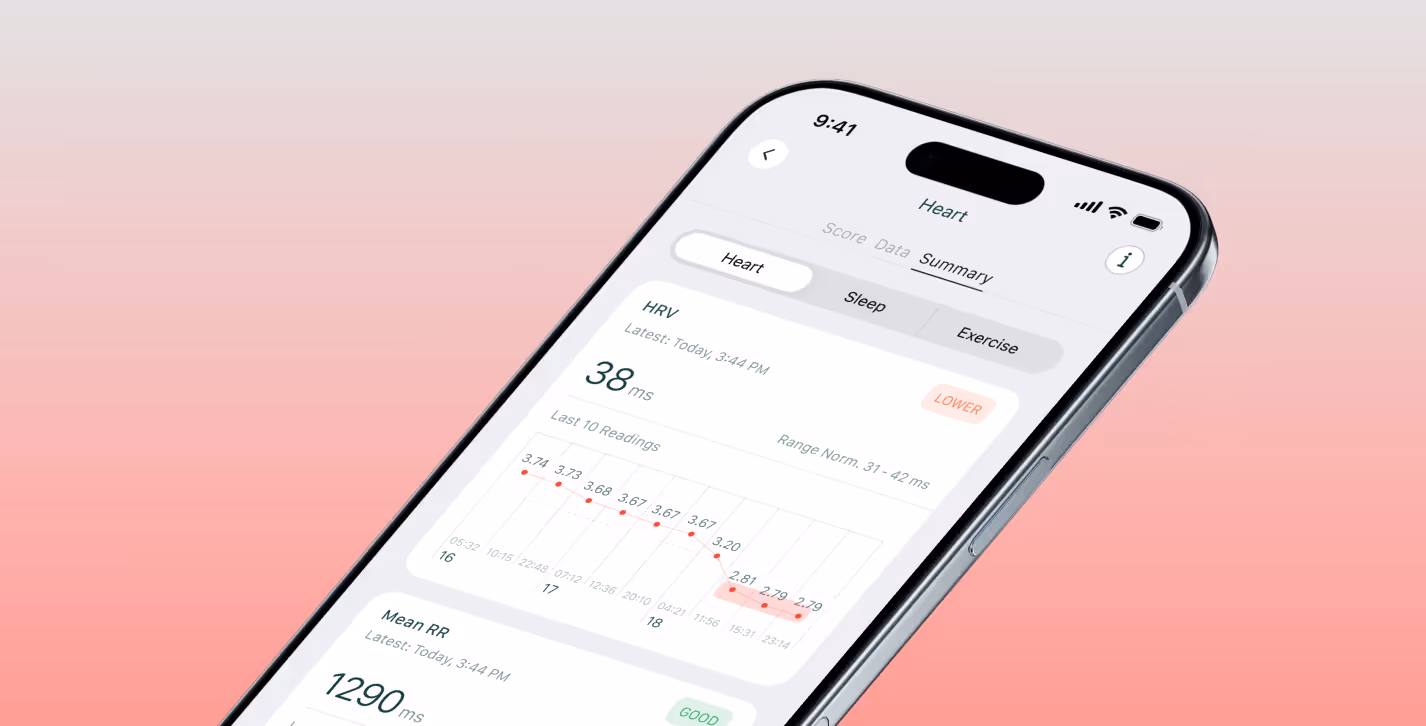
Your heart powers every move, thought, and moment of your day, but its signals are often hidden.
Bright tracks your cardiovascular health in context, connecting heart rate, variability, and strain to your sleep, activity, and recovery. By seeing how your heart responds to daily life, workouts, and stress, you gain insights into your endurance, resilience, and overall wellbeing.
Instead of focusing on a single number, Bright shows how your heart fits into the bigger picture of your health, so you can make choices that strengthen your cardiovascular performance and keep your energy flowing.
Close
Water logging
Hydration made effortless.
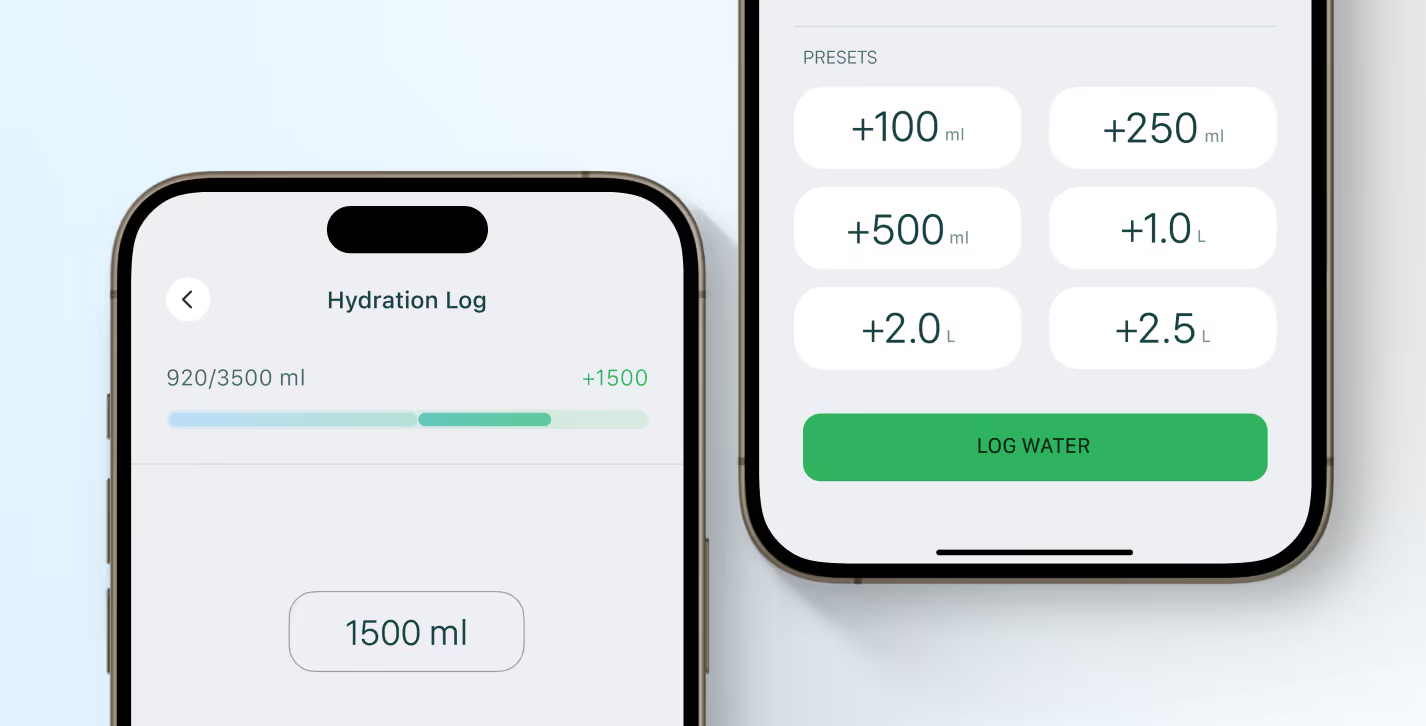
Staying hydrated is simple but easy to forget.
Bright helps you track your water intake quickly and effortlessly, so you always know when you’re reaching your daily goal. With clear reminders and easy logging, keeping on top of hydration becomes second nature, helping you feel alert, focused, and ready for your day.
Even small improvements in hydration can support your overall health, helping your body perform, recover, and feel its best.
Close
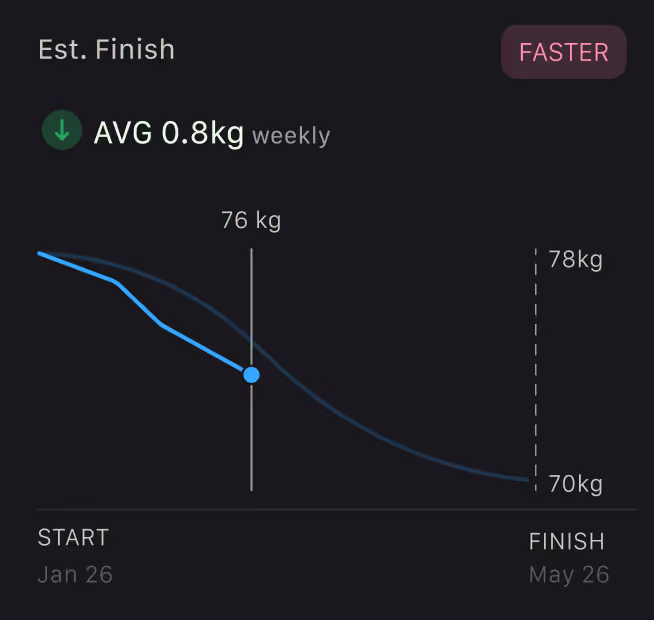
Weight Tracking
Weight, without
the noise.
Your weight is more than just a number. It’s a signal, not a verdict.
Bright helps you track trends over time, filtering out daily fluctuations and letting you see meaningful changes that reflect your health and progress.
By connecting weight data with your activity, nutrition, and recovery, you get a clear, balanced view, so you can make decisions based on trends, not stress.
Close
Nutrient Analysis
Know what your body is actually getting.
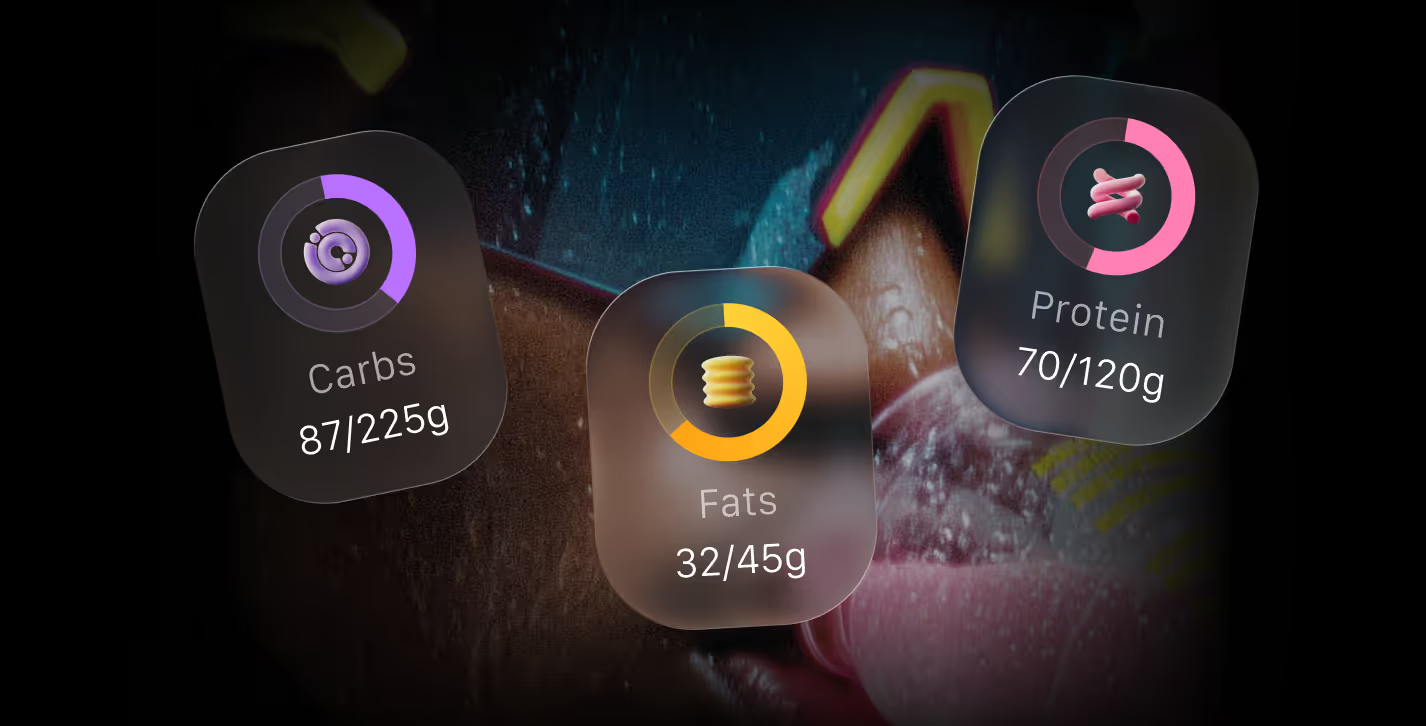
The food you eat is more than calories. It’s a mix of nutrients that fuel your energy, recovery, and overall wellbeing.
Bright breaks down your intake into macronutrients and key micronutrients, showing you exactly what your body is getting and how it supports your daily performance.
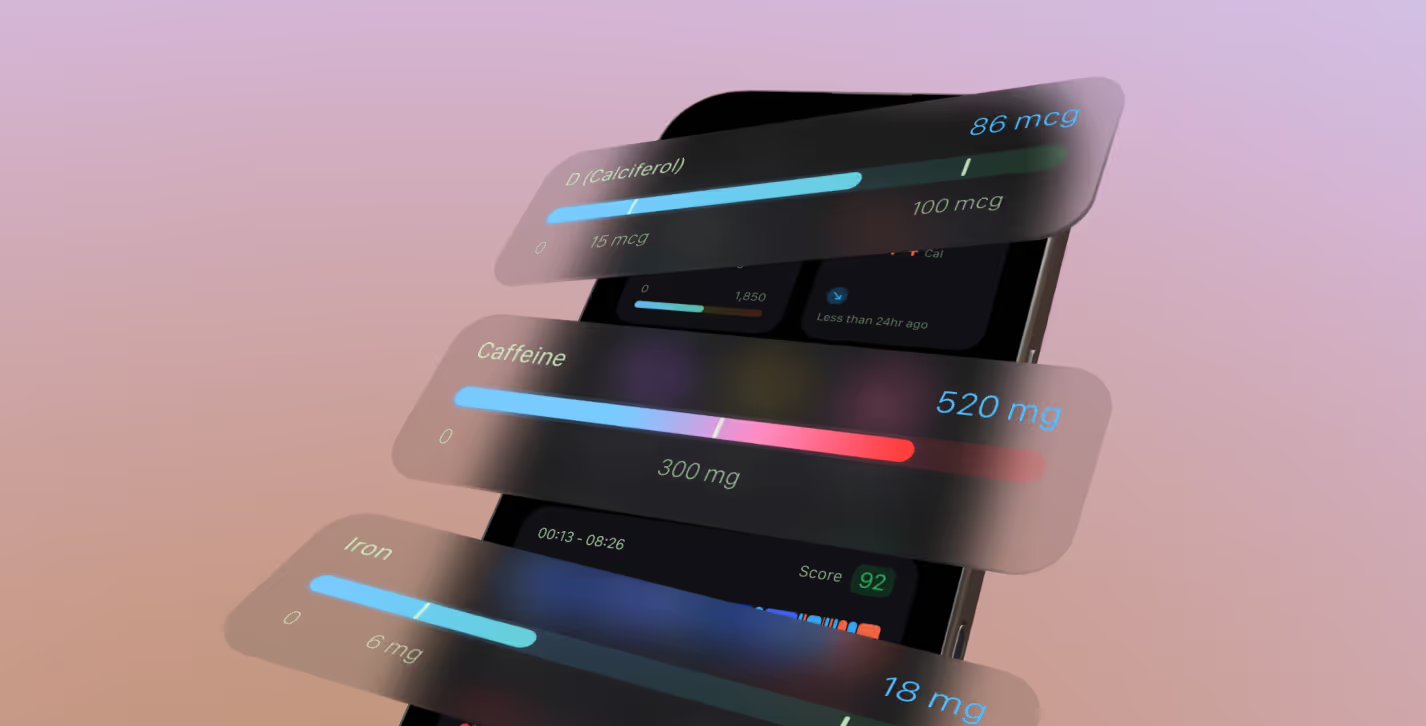
By connecting nutrient data to your activity, sleep, and health scores, you can see which choices boost your energy, aid recovery, and keep your body functioning at its best.
Close
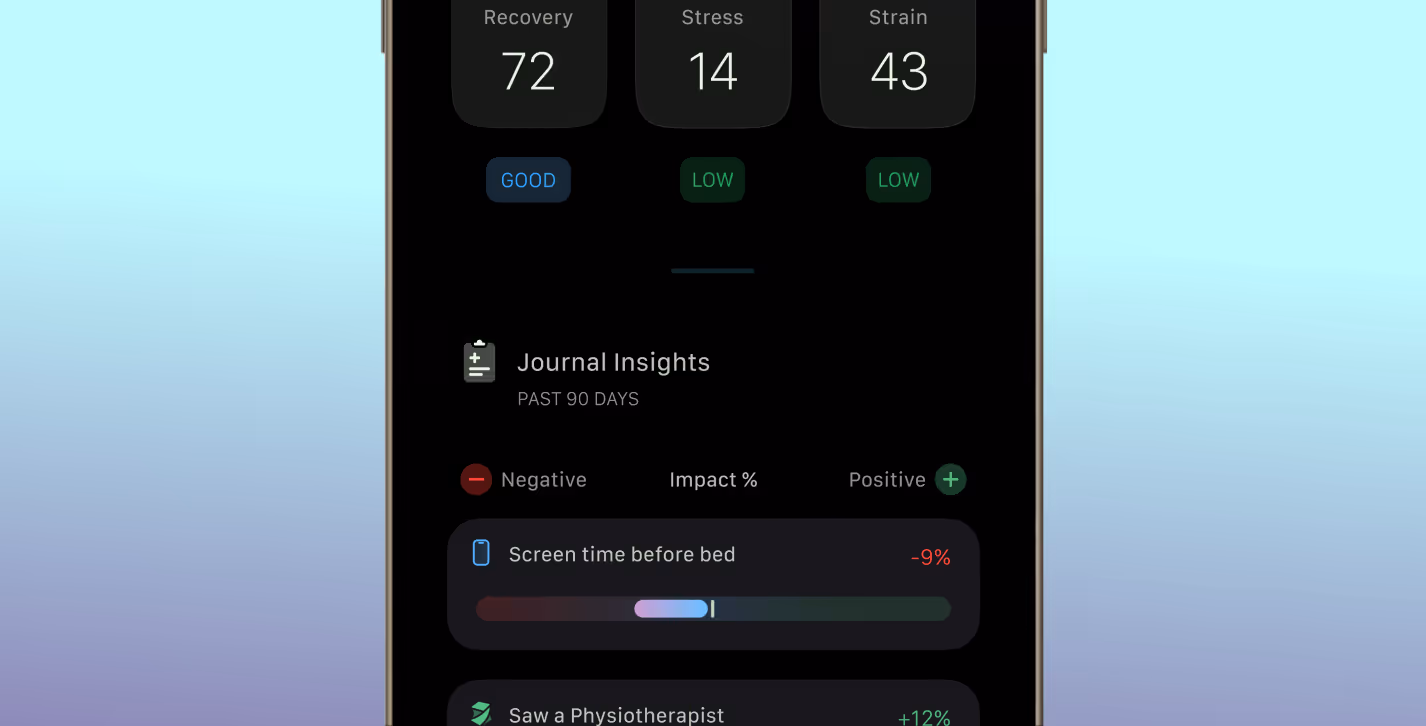
Health Scores
Metrics that matter.
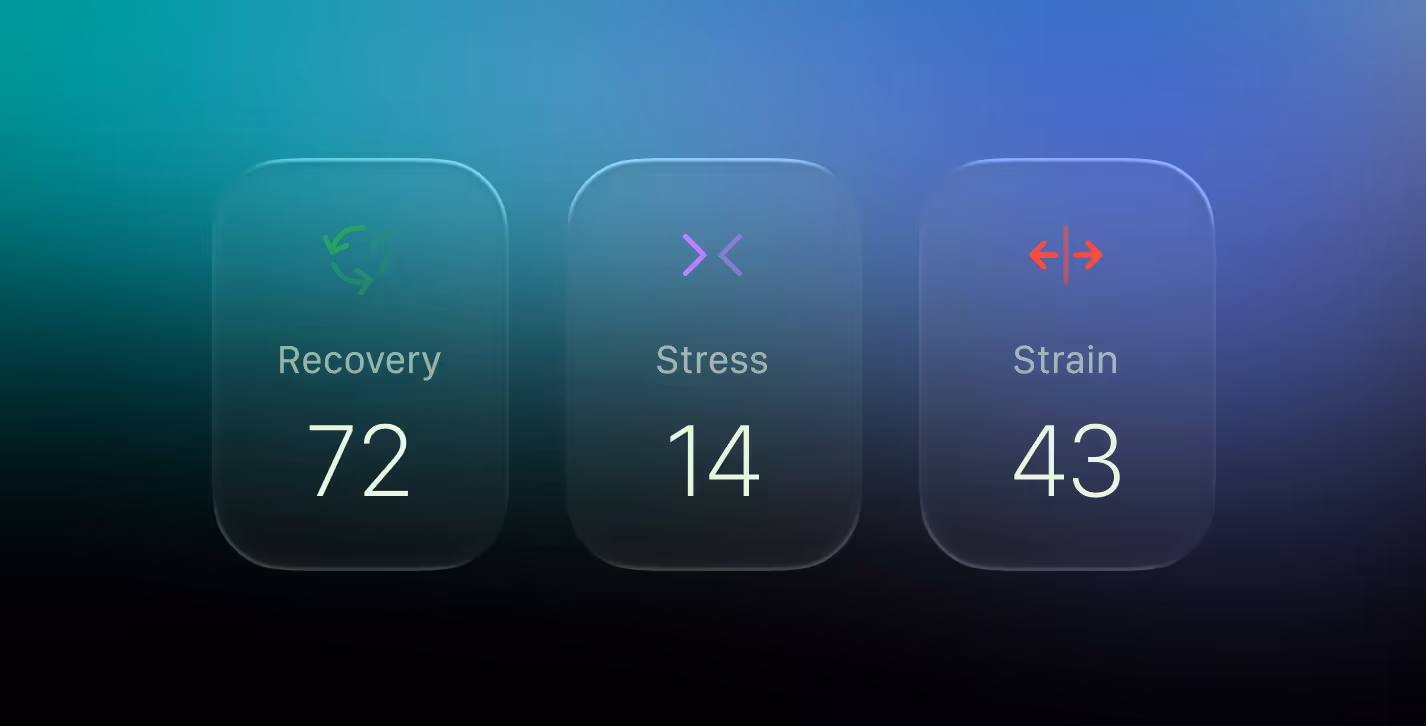
Recovery, stress, and strain aren’t just numbers, they’re signals your body sends every day. Bright combines these metrics to give you a clear picture of how well your body is coping with daily demands, workouts, and lifestyle factors. Instead of guessing how you’re doing, you can see when to push, when to rest, and when small adjustments can make a big difference.
By connecting Health Scores with sleep, activity, nutrition, and heart data, Bright shows how each part of your health impacts the others. Over time, these insights help you optimise performance, protect your energy, and make smarter, informed choices that support long-term wellbeing.
Close
Body Recomposition
Track change beyond the scale.
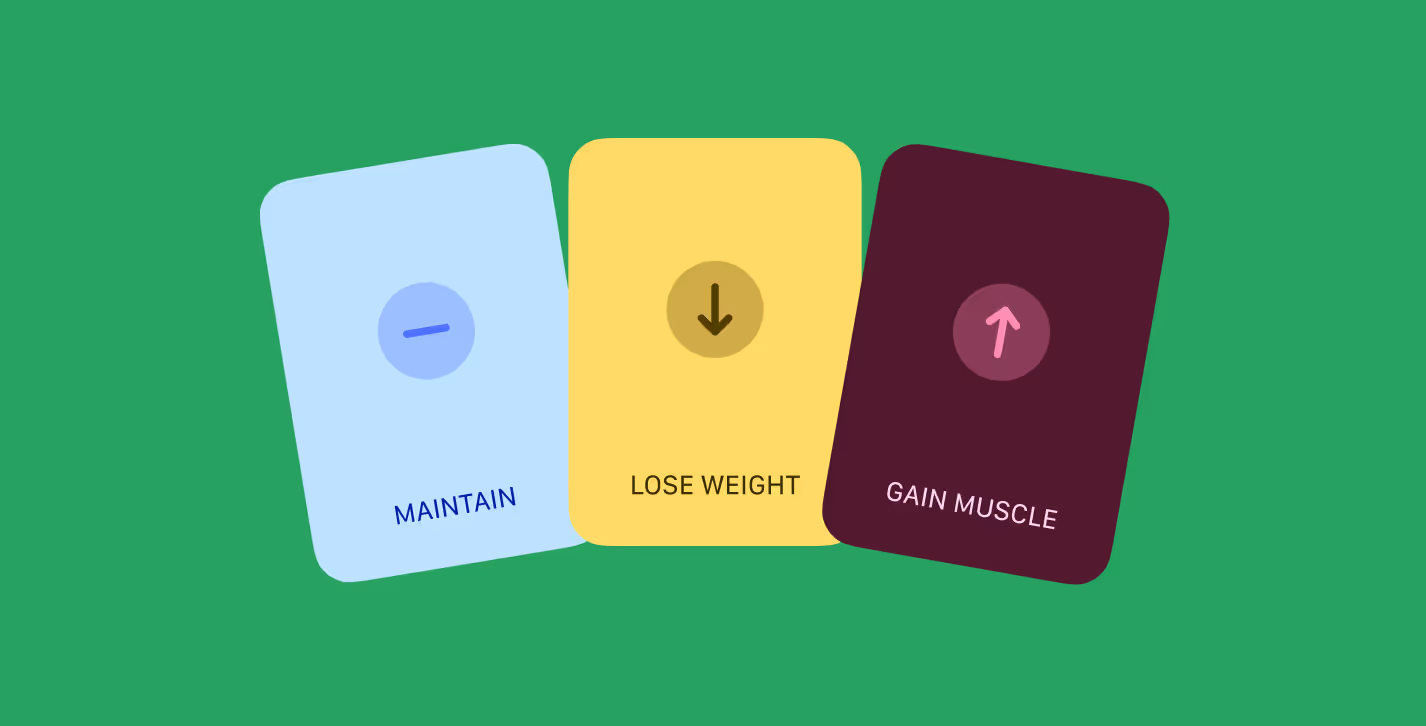
Your body is constantly changing, but the scale only tells part of the story.
Bright helps you track shifts in body composition; muscle, fat, and more, so you can see real progress over time. By connecting these changes to your nutrition, activity, and recovery, you get a clear view of how your efforts are shaping your body and supporting overall health.
Instead of fixating on numbers alone, Bright lets you focus on the changes that matter: improving strength, energy, and wellbeing, day by day.
Close
Health Journal
Your health,
in context.

Tracking your health is more than numbers. It’s about understanding patterns, triggers, and trends in your daily life.
Bright’s Health Journal lets you log moods, symptoms, habits, and experiences alongside your sleep, activity, nutrition, and recovery data. By combining subjective insights with objective metrics, you can see how your choices and lifestyle affect your energy, performance, and wellbeing over time.
Instead of scattered notes or forgotten details, Bright gives your health story clarity, helping you make smarter decisions and notice changes before they become problems.
Close